plot_by_properties#
- geetools.FeatureCollectionAccessor.plot_by_properties(type='bar', featureId='system:index', properties=[], labels=[], colors=[], ax=None, **kwargs)#
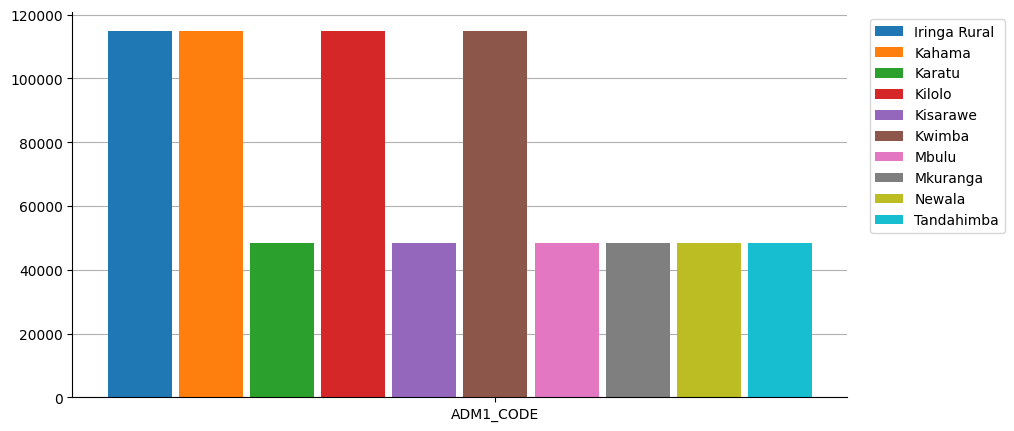
Plot the values of a
ee.FeatureCollectionby property.Each features will be represented by a color and each property will be a bar of the bar chart.
Warning
This function is a client-side function.
- Parameters:
type (str) – The type of plot to use. Defaults to
"bar". can be any type of plot from the python libmatplotlib.pyplot. If the one you need is missing open an issue!featureId (str) – The property to use as the y-axis (name the features). Defaults to
"system:index".properties (list | ee.List) – A list of properties to plot. Defaults to all properties.
labels (list) – A list of labels to use for plotting the properties. If not provided, the default labels will be used. It needs to match the properties’ length.
colors (list) – A list of colors to use for plotting the properties. If not provided, the default colors from the matplotlib library will be used.
ax (matplotlib.axes.Axes | None) – The matplotlib axes to use. If not provided, the plot will be sent to a new figure.
kwargs – Additional arguments from the
pyplotfunction.
- Return type:
See also
byProperties: Get a dictionary with all feature values for each property.plot_by_features: Plot the values of a :py:class:`ee.FeatureCollection` by feature.plot_hist: Plot the histogram of a specific property.plot: Plot the featureCollection on a map using the provided property.
Examples
import ee, geetools
from geetools.utils import initialize_documentation
from matplotlib import pyplot as plt

initialize_documentation()

# start a plot object from matplotlib library
fig, ax = plt.subplots(figsize=(10, 5))

# plot on this object the 10 first items of the FAO GAUL level 2 feature collection
# for each one of them (marked with it's "ADM2_NAME" property) we plot the value of the "ADM1_CODE" property
fc = ee.FeatureCollection("FAO/GAUL/2015/level2").limit(10)
fc.geetools.plot_by_properties(featureId="ADM2_NAME", properties=["ADM1_CODE"], ax=ax)
<Axes: >