plot#
- geetools.ee_feature_collection.FeatureCollectionAccessor.plot(ax=None, property='', crs='EPSG:4326', cmap='viridis', boundaries=False, color='k')#
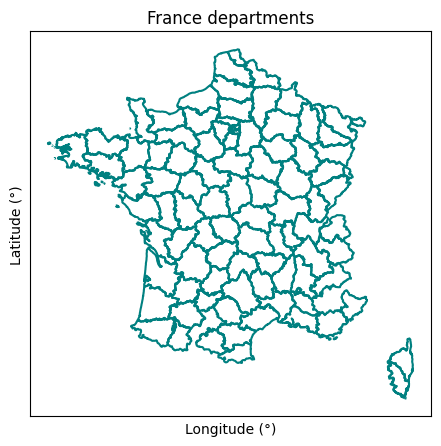
Plot the featureCollection on a map using the provided property.
Warning
This function is a client-side function.
- Parameters:
property (str) – The property to use to color the features.
ax (matplotlib.axes.Axes | None) – The axes to plot the map on.
crs (str) – The CRS to use for the map.
cmap (str) – The colormap to use for the colors.
boundaries (bool) – Whether to plot the features values or only the boundaries.
color (str) – The color to use for the boundaries.
See also
plot_by_features: Plot the values of a :py:class:`ee.FeatureCollection` by feature.plot_by_properties: Plot the values of a :py:class:`ee.FeatureCollection` by property.plot_hist: Plot the histogram of a specific property.
Examples
import ee, geetools
from geetools.utils import initialize_documentation
from matplotlib import pyplot as plt

initialize_documentation()

# start a plot object from matplotlib library
fig, ax = plt.subplots(figsize=(10, 5))

# plot france geometry on the map
france = (
    ee.FeatureCollection("FAO/GAUL/2015/level2")
    .filter(ee.Filter.eq("ADM0_NAME", "France"))
    .geetools.plot(boundaries=True, color="teal", ax=ax)
)

# style the figure
ax.set_title("France departments")
ax.set_xlabel("Longitude (°)")
ax.set_ylabel("Latitude (°)")
ax.set_xticks([])
ax.set_yticks([])

fig.show()