plot_hist#
- geetools.ee_feature_collection.FeatureCollectionAccessor.plot_hist(property, label='', ax=None, color=None, **kwargs)#
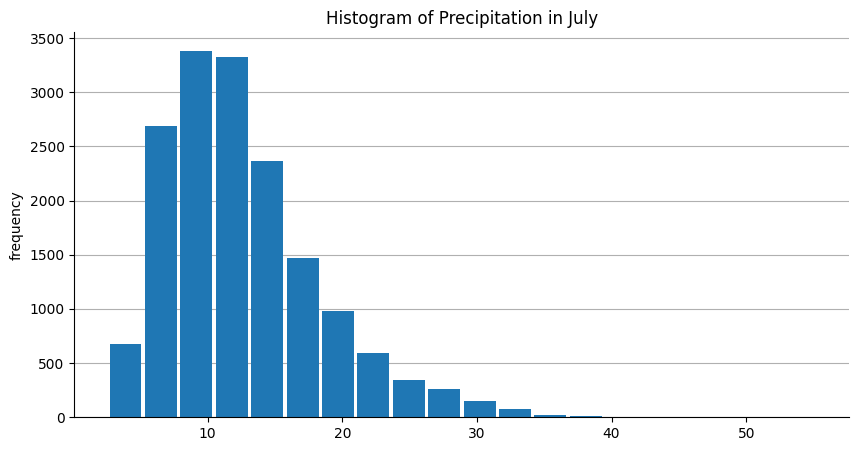
Plot the histogram of a specific property.
Warning
This function is a client-side function.
- Parameters:
label (str) – The label to use for the property. If not provided, the property name will be used.
ax (matplotlib.axes.Axes | None) – The matplotlib axes to use. If not provided, the plot will be send to the current axes (
plt.gca())color – The color to use for the plot. If not provided, the default colors from the matplotlib library will be used.
kwargs – Additional arguments from the
pyplot.histfunction.
- Return type:
See also
plot_by_features: Plot the values of a ``ee.FeatureCollection`` by feature.plot_by_properties: Plot the values of a FeatureCollection by property.plot: Plot the featureCollection on a map using the provided property.
Examples
import ee, geetools
from geetools.utils import initialize_documentation
from matplotlib import pyplot as plt

initialize_documentation()

# start a plot object from matplotlib library
fig, ax = plt.subplots(figsize=(10, 5))
ax.set_title('Histogram of Precipitation in July')
ax.set_xlabel('Precipitation (mm)')


# build the histogram of the precipitation band for the month of july in the PRISM dataset
normClim = ee.ImageCollection('OREGONSTATE/PRISM/Norm81m').toBands()
region = ee.Geometry.Rectangle(-123.41, 40.43, -116.38, 45.14)
climSamp = normClim.sample(region, 5000)
climSamp.geetools.plot_hist("07_ppt", ax=ax, bins=20)

fig.show()