addId#
- geetools.ee_feature_collection.FeatureCollectionAccessor.addId(name='id', start=1)#
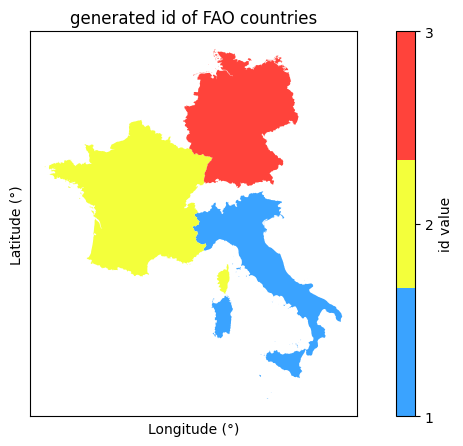
Add a unique numeric identifier, starting from parameter
start.- Parameters:
- Returns:
The parsed collection with a new id property
- Return type:
Example
import ee, geetools
from geetools.utils import initialize_documentation
from matplotlib import pyplot as plt
from matplotlib.colors import ListedColormap

initialize_documentation()

# create a featureCollection from the 3 first countries of the FAO GAUL dataset
# then add an id property to each feature and show them in the console
fc = (
    ee.FeatureCollection("FAO/GAUL/2015/level0")
    .filter(ee.Filter.inList("ADM0_NAME", ["France", "Germany", "Italy"]))
    .select(["ADM0_NAME", "ADM0_CODE"])
    .geetools.addId()
)

# create a figure to show the created featureCollection generated "id" property
fig, ax = plt.subplots(figsize=(10, 5))
cmap = ListedColormap(["#3AA3FF", "#F3FF3B", "#FF433B"])
fc.geetools.plot(ax=ax, property="id", cmap=cmap)

fig.colorbar(ax.collections[0], label="id value", ticks=[1, 2, 3])
ax.set_title("generated id of FAO countries")
ax.set_xlabel("Longitude (°)")
ax.set_ylabel("Latitude (°)")
ax.set_xticks([])
ax.set_yticks([])

fig.show()