plot_by_properties#
- geetools.ee_feature_collection.FeatureCollectionAccessor.plot_by_properties(type='bar', featureId='system:index', properties=[], labels=[], colors=[], ax=None, **kwargs)#
Plot the values of a FeatureCollection by property.
Each features will be represented by a color and each property will be a bar of the bar chart.
Warning
This function is a client-side function.
- Parameters:
type (str) – The type of plot to use. Defaults to “bar”. can be any type of plot from the python lib matplotlib.pyplot. If the one you need is missing open an issue!
featureId (str) – The property to use as the y-axis (name the features). Defaults to “system:index”.
properties (list | ee.List) – A list of properties to plot. Defaults to all properties.
labels (list) – A list of labels to use for plotting the properties. If not provided, the default labels will be used. It needs to match the properties length.
colors (list) – A list of colors to use for plotting the properties. If not provided, the default colors from the matplotlib library will be used.
ax (matplotlib.axes.Axes | None) – The matplotlib axes to use. If not provided, the plot will be send to a new figure.
kwargs – Additional arguments from the
pyplotfunction.
- Return type:
See also
ee.FeatureCollection.geetools.byProperties: Get a dictionary with all feature values for each properties.ee.FeatureCollection.geetools.plot_by_features: Plot the values of a ``ee.FeatureCollection`` by feature.ee.FeatureCollection.geetools.plot_hist: Plot the histogram of a specific property.ee.FeatureCollection.geetools.plot: Plot the featureCollection on a map using the provided property.
Examples
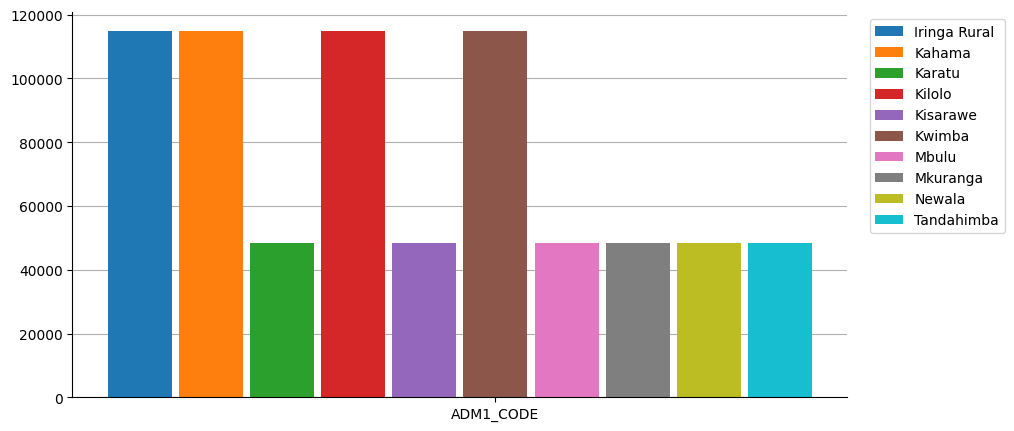
import ee, geetools
from geetools.utils import initialize_documentation
from matplotlib import pyplot as plt

initialize_documentation()

# start a plot object from matplotlib library
fig, ax = plt.subplots(figsize=(10, 5))

# plot on this object the 10 first items of the FAO GAUL level 2 feature collection
# for each one of them (marked with it's "ADM2_NAME" property) we plot the value of the "ADM1_CODE" property
fc = ee.FeatureCollection("FAO/GAUL/2015/level2").limit(10)
fc.geetools.plot_by_properties(featureId="ADM2_NAME", properties=["ADM1_CODE"], ax=ax)
<Axes: >