Map FeatureCollection#
The geetools extension contains a set of functions for rendering maps from ee.FeatureCollection objects. Use the following function descriptions and examples to determine the best function and chart type for your purpose.
Set up environment#
Install all the required packages and perform the import statement upstream.
# uncomment if installation of libs is necessary
# !pip install earthengine-api geetools
from IPython.display import display
from matplotlib import pyplot as plt

import ee
import geetools #noqa: F401
# uncomment if authetication to GEE is needed
# ee.Authenticate()
# ee.Intialize(project="<your_project>")
Example data#
The following examples rely on a ee.FeatureCollection composed of all the hydroshed bassins from south america.
region = ee.Geometry.BBox(-80, -60, -20, 20);
fc = ee.FeatureCollection('WWF/HydroATLAS/v1/Basins/level04').filterBounds(region)
Map Vector#
See API
plot: Plot the featureCollection on a map using the provided property.
An ee.FeatureCollection is a vector representation of geographical properties. A user can be interested by either the property evolution across the landscape or the geometries associated with it. The plot is coverinig both use cases.
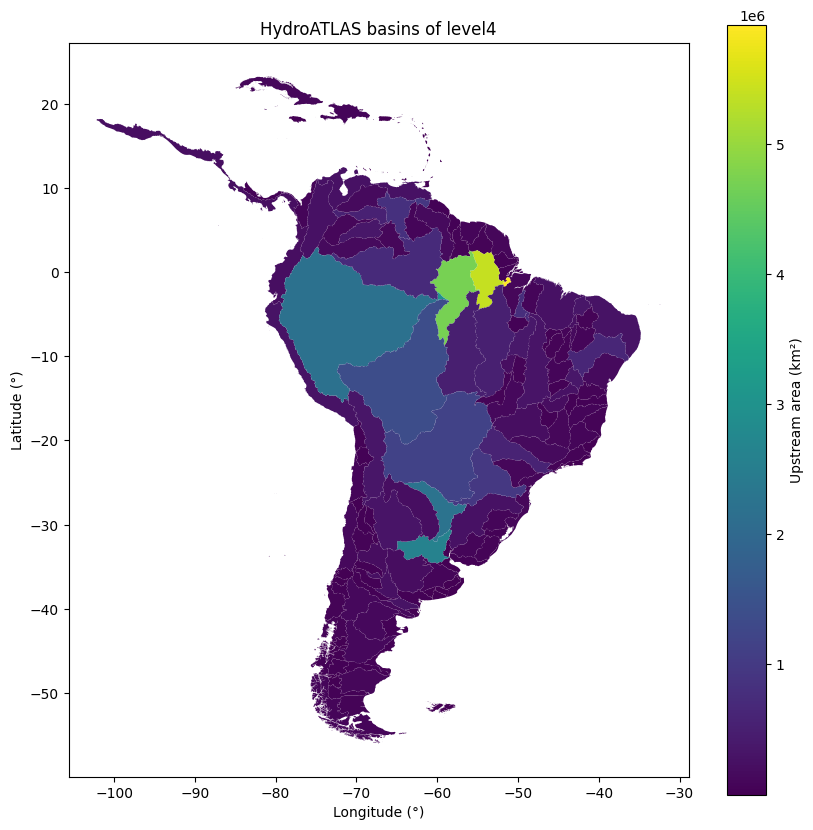
Map a property#
A single property can be ploted on a map using matplotlib. The following example is showing the bassin area in km².
First create a matplotlib figure and axis, then you can add the bassins to the map using the plot method. By default it will display the first property of the features. In our case we will opt to display the area of the bassins in km² i.e. the “UP_AREA” property. Finally that we have the plot, we can customize it with matplotlib. For example, we can add a title and a colorbar.
# create the plot
fig, ax = plt.subplots(figsize=(10, 10))

# generate the graph
fc.geetools.plot(ax=ax, property="UP_AREA", cmap="viridis")

# you can then customize the figure as you would for any other matplotlib object
fig.colorbar(ax.collections[0], label="Upstream area (km²)")
ax.set_title("HydroATLAS basins of level4")
ax.set_xlabel("Longitude (°)")
ax.set_ylabel("Latitude (°)")

plt.show()
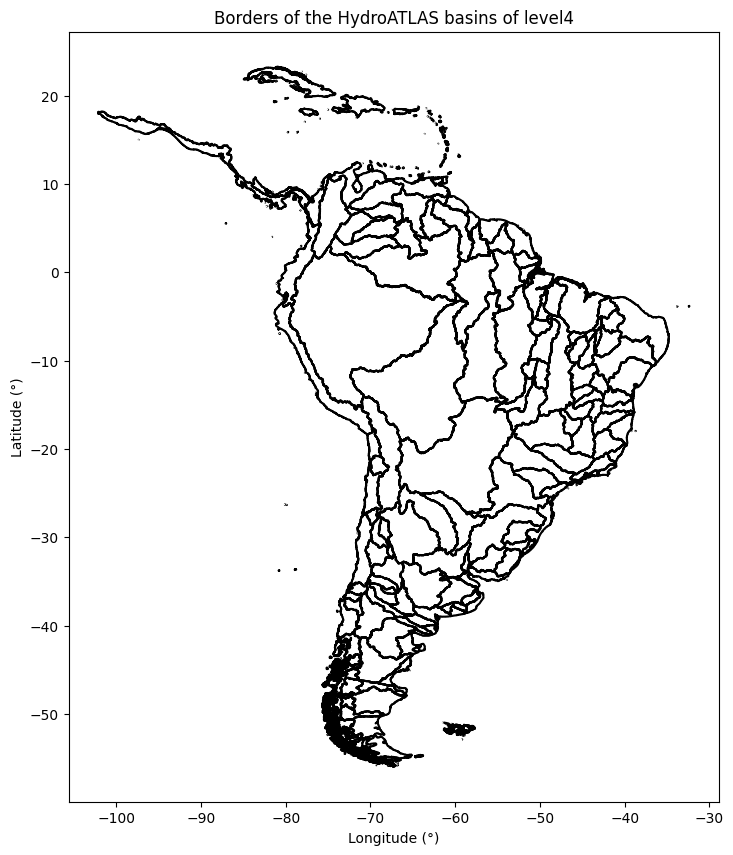
Map geometries#
Alternatively if you only want to plot the geometries of the featurecollection on a map, you can use the plot method with the boundares parameter set to True.
Similarly to the previous example we start by creating a pyplot figure and axis, then you can start plotting the geometries and finally customize the plot.
plt.ioff() # remove interactive for the sake of the example
fig, ax = plt.subplots(figsize=(10, 10))

# create the graph
fc.geetools.plot(ax=ax, boundaries=True)

# you can then customize the figure as you would for any other matplotlib object
ax.set_title("Borders of the HydroATLAS basins of level4")
ax.set_xlabel("Longitude (°)")
ax.set_ylabel("Latitude (°)")

plt.show()