toImage#
- geetools.FeatureCollectionAccessor.toImage(color=0, width='')#
Paint the current
ee.FeatureCollectionto an Image.It’s a simple wrapper on
ee.Image.paint()method.- Parameters:
color (str | ee.String | int | ee.Number) – The pixel value to paint into every band of the input image, either as a number which will be used for all features, or the name of a numeric property to take from each feature in the collection.
width (str | ee.String | int | ee.Number) – Line width, either as a number which will be the line width for all geometries, or the name of a numeric property to take from each feature in the collection. If unspecified, the geometries will be filled instead of outlined.
- Returns:
The painted image.
- Return type:
Examples
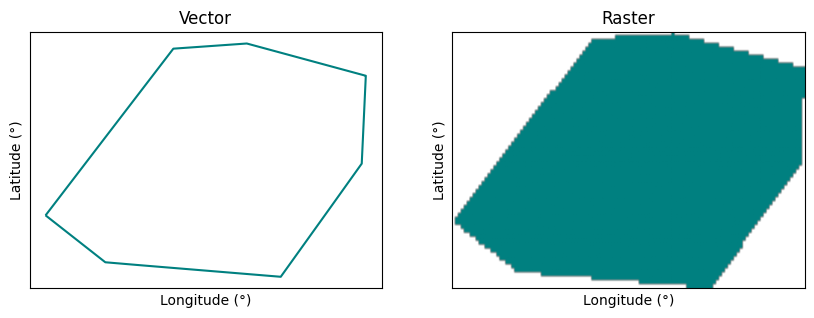
import ee, geetools
from geetools.utils import initialize_documentation
from matplotlib import pyplot as plt
from matplotlib.colors import ListedColormap

initialize_documentation()

# extract the featureCollection of the Vatican from the FAO gaul dataset
vatican = (
    ee.FeatureCollection("FAO/GAUL/2015/level0")
    .filter(ee.Filter.eq("ADM0_NAME", "Holy See"))
)

# transform the featureCollection into an image
img = vatican.geetools.toImage(color=1).rename("gaul")

# Define a custom colormap for the raster representation
# it will only have 1 color: teal for the first value and white for everything else
cmap = ListedColormap(['teal', 'white'])

# create the axes for the plots
fig, axes = plt.subplots(1, 2, figsize=(10, 5))

# customize the layout of the 2 plots
for ax in axes:
    ax.set_xlabel("Longitude (°)")
    ax.set_ylabel("Latitude (°)")
    ax.set_xticks([])
    ax.set_yticks([])

# add the vector on the first plot
axes[0].set_title("Vector")
vatican.geetools.plot(ax=axes[0], color="teal", boundaries=True)

# add the raster on the second plot
axes[1].set_title("Raster")
img.geetools.plot(region=vatican.bounds(), bands=["gaul"], ax=axes[1], cmap=cmap)

fig.show()