plot_doy_by_years#
- geetools.ImageCollectionAccessor.plot_doy_by_years(band, region, reducer='mean', dateProperty='system:time_start', colors=[], ax=None, scale=10000, crs=None, crsTransform=None, bestEffort=False, maxPixels=10**7, tileScale=1)#
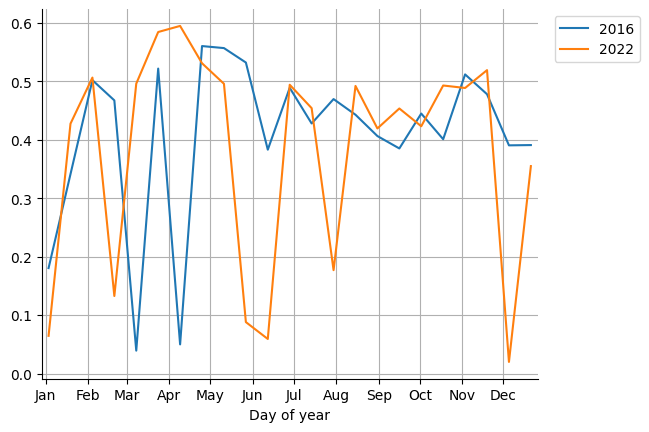
Plot the reduced data for each image in the collection by years for a single band.
This method is plotting the reduced data for each image in the collection by years for a single band.
- Parameters:
band (str) – The band to reduce.
region (ee.Geometry) – The region to reduce the data on.
reducer (str | ee.Reducer) – The name of the reducer or a reducer object to use. Default is “mean”.
dateProperty (str) – The property to use as date for each image. Default is “system:time_start”.
colors (list) – The colors to use for the regions. If empty, the default colors are used.
ax (matplotlib.axes.Axes | None) – The matplotlib axes to plot the data on. If None, a new figure is created.
scale (int) – The scale in meters to use for the reduction. default is 10000m
crs (str | None) – The projection to work in. If unspecified, the projection of the image’s first band is used. If specified in addition to scale, rescaled to the specified scale.
crsTransform (list | None) – The list of CRS transform values. This is a row-major ordering of the 3x2 transform matrix. This option is mutually exclusive with ‘scale’, and replaces any transform already set on the projection.
bestEffort (bool) – If the polygon would contain too many pixels at the given scale, compute and use a larger scale which would allow the operation to succeed.
maxPixels (int | None) – The maximum number of pixels to reduce. Defaults to 1e7.
tileScale (float) – A scaling factor between 0.1 and 16 used to adjust aggregation tile size; setting a larger tileScale (e.g., 2 or 4) uses smaller tiles and may enable computations that run out of memory with the default.
- Returns:
A matplotlib axes with the reduced values for each year and each day.
- Return type:
See also
doyByBands: Aggregate the images that occurs on the same day and then reduce each band on a single region.doyByRegions: Aggregate the images that occurs on the same day and then reduce a single band on multiple regions.doyBySeasons: Aggregate for each year on a single region a single band.doyByYears: Aggregate for each year on a single region a single band.plot_doy_by_bands: Plot the reduced data for each image in the collection by bands on a specific region.plot_doy_by_regions: Plot the reduced data for each image in the collection by regions for a single band.plot_doy_by_seasons: Plot the reduced data for each image in the collection by years for a single band.
Examples
import ee, geetools
from geetools.utils import initialize_documentation

initialize_documentation()

collection = (
    ee.ImageCollection("LANDSAT/LC08/C02/T1_TOA")
    .filterBounds(ee.Geometry.Point(-122.262, 37.8719))
    .filter(ee.Filter.Or(
        ee.Filter.date("2022-01-01", "2022-12-31"),
        ee.Filter.date("2016-01-01", "2016-12-31"),
    ))
    .map(lambda i: ee.Image(i).addBands(
        ee.Image(i)
        .normalizedDifference(["B5", "B4"])
        .rename("NDVI")
    ))
)

collection.geetools.plot_doy_by_years(
    band = "NDVI",
    region = ee.Geometry.Point(-122.262, 37.8719).buffer(1000),
    reducer = "mean",
    dateProperty = "system:time_start",
    scale = 10000
)
<Axes: xlabel='Day of year'>