Reduce ImageCollection#
THe Earth Engine API provides 2 ways to reduce images: reduceRegion and reduceRegions. geetools is making these methods also available for ee.ImageCollection objects.
Set up environment#
Install all the required libs if necessary and perform the import statements upstream.
# uncomment if installation of libs is necessary
# !pip install earthengine-api geetools
import ee
import geetools #noqa: F401
import geopandas as gpd
from matplotlib import pyplot as plt
import pandas as pd
# uncomment if initialization is required
# ee.Initialize()
Example data#
The following examples rely on a ee.FeatureCollection composed of three ecoregion features that define regions by which to reduce image data. The ImageCollection data loads the modis vegetation indicies and subset the 2010 2020 decade of images.
## Import the example feature collection and drop the data property.
ecoregions = (
    ee.FeatureCollection("projects/google/charts_feature_example")
    .select(["label", "value", "warm"])
)


## Load MODIS vegetation indices data and subset of 4 images.
vegIndices = (
    ee.ImageCollection("MODIS/061/MOD13A1")
    .filter(ee.Filter.date("2010-01-01", "2010-02-28"))
    .select(["NDVI", "EVI"])
)
Reduce over single region#
Using reduceRegion you can reduce an ee.ImageCollection over a single region.
The function will return a ee.Dictionary with the reduced values of each band grouped under each image Id as key.
It will return a ee.Dictionary with the following shape:
{
    "image1": {"band1": value1, "band2": value2, ...},
    "image2": {"band1": value1, "band2": value2, ...},
}
where image*is the id of the image as per specified property (casted to string) and band* is the name of the band.
result = vegIndices.geetools.reduceRegion(
    reducer = ee.Reducer.mean(),
    idProperty = "system:time_start",
    idType = ee.Date,
    geometry = ecoregions.filter(ee.Filter.eq("label", "Forest")).geometry(),
    scale = 500
)
result.getInfo()
{'2010-01-01T00-00-00': {'EVI': 1912.5637702562262, 'NDVI': 3273.672377532786},
 '2010-01-17T00-00-00': {'EVI': 3276.7642398350026, 'NDVI': 7331.223758333469},
 '2010-02-02T00-00-00': {'EVI': 2963.2602251579947, 'NDVI': 7845.514550793475},
 '2010-02-18T00-00-00': {'EVI': 3276.4948281435295, 'NDVI': 7951.898544727663}}
Then a user can easily transform this data into a dataframe and use any tools from the Python ecosystem:
df = pd.DataFrame(result.getInfo()).transpose()
df.head(15)
| EVI | NDVI | |
|---|---|---|
| 2010-01-01T00-00-00 | 1912.563770 | 3273.672378 |
| 2010-01-17T00-00-00 | 3276.764240 | 7331.223758 |
| 2010-02-02T00-00-00 | 2963.260225 | 7845.514551 |
| 2010-02-18T00-00-00 | 3276.494828 | 7951.898545 |
Reduce over muliple regions#
Using reduceRegions you can reduce an ee.ImageCollection over multiple regions.
The result will be shaped as a ee.FeatureCollection with 2 primary keys.
The
idPropertyas key for images stored in final feature asimage_idThe id of the feature stored in the final features as
feature_id.
Each feature will have the same properties as the original feature collection + the reduced value of the corresponding image over the feature geometry. The user can specify all the parameter of the reduction and specify which image property will be used as the id of the image.
result = vegIndices.geetools.reduceRegions(
    reducer = ee.Reducer.mean(),
    idProperty = "system:time_start",
    idType = ee.Date,
    collection = ecoregions,
    scale = 500
)

# we can display the result as a table using geopandas
gdf = gpd.GeoDataFrame.from_features(result.getInfo()["features"])
gdf.head(15)
| geometry | EVI | NDVI | feature_id | image_id | label | value | warm | |
|---|---|---|---|---|---|---|---|---|
| 0 | POLYGON ((-109.21 31.42, -108.3 31.42, -108.3 ... | 1014.455318 | 1797.930408 | 00000000000000000000 | 2010-01-01T00-00-00 | Desert | 0 | 1 |
| 1 | POLYGON ((-109.21 31.42, -108.3 31.42, -108.3 ... | 971.166098 | 1900.816413 | 00000000000000000000 | 2010-01-17T00-00-00 | Desert | 0 | 1 |
| 2 | POLYGON ((-109.21 31.42, -108.3 31.42, -108.3 ... | 973.384019 | 1825.576545 | 00000000000000000000 | 2010-02-02T00-00-00 | Desert | 0 | 1 |
| 3 | POLYGON ((-109.21 31.42, -108.3 31.42, -108.3 ... | 986.248517 | 1790.578384 | 00000000000000000000 | 2010-02-18T00-00-00 | Desert | 0 | 1 |
| 4 | POLYGON ((-122.73 43.45, -122.28 43.45, -122.2... | 1912.563770 | 3273.672378 | 00000000000000000001 | 2010-01-01T00-00-00 | Forest | 1 | 1 |
| 5 | POLYGON ((-122.73 43.45, -122.28 43.45, -122.2... | 3276.764240 | 7331.223758 | 00000000000000000001 | 2010-01-17T00-00-00 | Forest | 1 | 1 |
| 6 | POLYGON ((-122.73 43.45, -122.28 43.45, -122.2... | 2963.260225 | 7845.514551 | 00000000000000000001 | 2010-02-02T00-00-00 | Forest | 1 | 1 |
| 7 | POLYGON ((-122.73 43.45, -122.28 43.45, -122.2... | 3276.494828 | 7951.898545 | 00000000000000000001 | 2010-02-18T00-00-00 | Forest | 1 | 1 |
| 8 | POLYGON ((-101.81 41.7, -100.53 41.7, -100.53 ... | 704.321312 | 1057.387456 | 00000000000000000002 | 2010-01-01T00-00-00 | Grassland | 2 | 0 |
| 9 | POLYGON ((-101.81 41.7, -100.53 41.7, -100.53 ... | 1231.157133 | 2044.010150 | 00000000000000000002 | 2010-01-17T00-00-00 | Grassland | 2 | 0 |
| 10 | POLYGON ((-101.81 41.7, -100.53 41.7, -100.53 ... | 1111.532233 | 1770.138801 | 00000000000000000002 | 2010-02-02T00-00-00 | Grassland | 2 | 0 |
| 11 | POLYGON ((-101.81 41.7, -100.53 41.7, -100.53 ... | 1055.246577 | 1797.979795 | 00000000000000000002 | 2010-02-18T00-00-00 | Grassland | 2 | 0 |
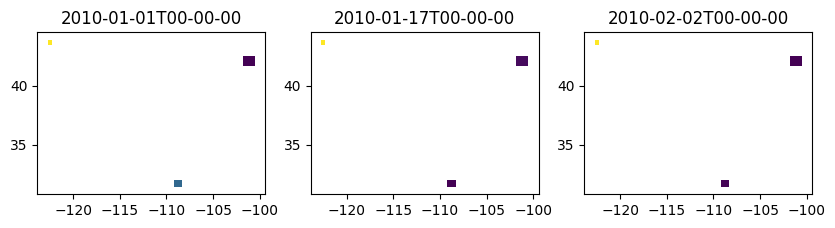
From this you can easily create chrono mapping of the regions or more custom figures that are not covered by the plot_* methods:
# Create a figure with 2 rows and 3 columns
fig, axes = plt.subplots(nrows=1, ncols=3, figsize=(10, 6))  # Adjust figsize as needed

# Flatten the 2D array of axes for easier access, if needed
axes_flat = axes.flatten()

# get a list of all the available dates
dates = vegIndices.aggregate_array("system:time_start").distinct()

# Plot the data
for i in range(3):
    ax = axes_flat[i]
    image_id = ee.Date(dates.get(i)).format("YYYY-MM-dd'T'HH-mm-ss")
    fc = result.filter(ee.Filter.eq("image_id", image_id))
    fc.geetools.plot(ax=ax, cmap="viridis", property="NDVI")
    ax.set_title(image_id.getInfo())